Why does high tide change with the day and the place?
Yesterday’s high tide was in the afternoon, but tomorrow’s table gives a different time. A nearby harbour has another time again. The Moon and Sun drive tides, while the ocean’s shape and local conditions affect how that rhythm reaches each coast. Use the prediction for the right location and date, rather than adding a fixed number of minutes to yesterday.
The Moon does not keep our 24-hour timetable
Earth turns while the Moon continues along its orbit in the same direction. A location on Earth takes about 24 hours and 50 minutes to face the Moon again. That helps explain why the lunar part of the tidal rhythm does not line up neatly with the clock on successive days.
But the sea is responding to several rhythms together. NOAA describes separate tidal constituents, including a principal lunar component and a solar component, which are combined to calculate a prediction. Their relative contributions and timing matter at each location. “Fifty minutes later tomorrow” is therefore a rough idea about the lunar rhythm, not a dependable calculation for your harbour. NOAA on the components of a tide prediction
A calendar day can also cut across the pattern awkwardly. When comparing daily tables, follow the sequence of events across midnight. Do not assume that the first high tide listed on one date is the obvious counterpart of the first entry on the next.
A coastline changes the answer
Tides travel through ocean basins rather than raising every shoreline at once. Coastline shape, water depth, the seafloor and the effects of Earth’s rotation all help shape the response. A bay, an estuary and an open coast can have different tidal ranges and timings, even though the same Moon is overhead. NOAA’s overview of local tidal differences
This is why a tide prediction belongs to a location. The nearest station in straight-line distance is not automatically interchangeable with a beach on the other side of a headland or inside a different inlet. If the official service does not cover the exact place, look for its guidance on the appropriate reference or local correction rather than inventing one.
Nor does the Moon being directly above you identify the moment of high tide. NOAA explicitly distinguishes the astronomical forcing from the locally delayed response. Why high tide need not coincide with the overhead Moon
Compare two invented local tide patterns
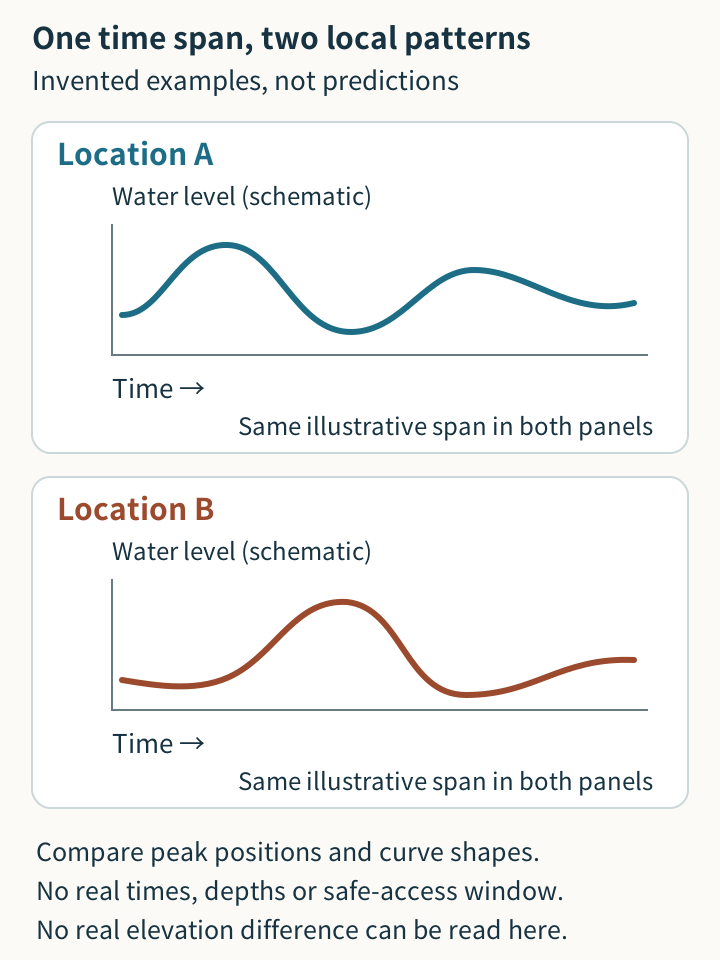
The two curves are teaching examples, not readings or forecasts. Their peaks occur at different positions along the same illustrative time span. There are no clock times, dates or height units to transfer to a real coast. The drawing is a prompt to compare shapes, not a map of where the water will be.
Two high tides is common, but not universal
Some locations have two broadly similar highs and lows, some have noticeably unequal pairs, and some have one high and one low in a day. The pattern can also change during the month. NOAA calls the common categories semidiurnal, mixed and diurnal. Different daily tidal patterns
The useful first step is to read what the chosen table actually contains. Do not fill a missing second high tide with a guess or force an unequal pair into a six-hour schedule. “High tide” describes a local maximum; it does not promise the same height as another maximum that day.
Read the small labels before the large curve
For a US location, start with NOAA Tide Predictions. Select the station and the dates you want to examine. Then check the settings that give the numbers their meaning:
- Station name and position: is this the intended location?
- Date range: does it include the correct day and year?
- Time basis: local time with daylight-saving adjustment, local standard time, or GMT?
- Height units: feet or metres?
- Datum: what reference level is used for the heights?
NOAA’s help page explains these options and the difference between harmonic stations and subordinate stations, whose predictions use adjustments from a reference station. You do not need to calculate those adjustments yourself. NOAA prediction settings
A height is measured above a stated reference, not automatically above the seabed or above the water you see now. When comparing locations, do not treat two numbers as a direct difference in sea-surface elevation without understanding their reference levels. A tide table is not, by itself, a depth reading for an unfamiliar channel.
For Japan, the Japan Meteorological Agency’s tide tables use Japan Standard Time and display heights in centimetres, with their reference specified. Other countries have their own official services and conventions. Check the labels again when changing provider or travelling.
Make one comparison you can explain
You can do this part at home. Choose one station and examine two consecutive dates. Note the sequence of high and low tides, their heights, and whether the pairs are similar. Keep the station, time basis, units and datum unchanged.
Then compare a second location for the same date. Write a simple conclusion such as “the listed morning peak occurs later at this station”. That is more precise than “the whole sea is two hours late”. You are describing those predictions, not proving which coastal feature caused the difference.
A short note with the station name, selected date, settings and source link is enough. If a saved image loses those labels, it loses much of its usefulness. Return to the official source when the date or plan changes.
A prediction is not permission to enter the water
Astronomical tide predictions do not include every change in the water level. Wind, air pressure and other weather effects can alter what actually reaches the coast. The National Oceanography Centre explains this distinction between predictable astronomical behaviour and total coastal water level. Tides, weather and observed water levels
Water height and current speed are also different quantities. High or low tide does not universally mean slack water. NOAA’s tide-and-current explanation
Do not use this article or a tide curve alone to decide whether to wade, cross a tidal route, launch a boat or ignore a closure. Those decisions also need current local warnings, conditions and activity-specific guidance. The payoff here is narrower and useful: knowing why tomorrow and the next harbour can differ, and how to read the prediction without dropping its context.
Sources and verification
Sources were checked on October 11, 2026 UTC. No particular day’s tide forecast is supplied. The diagram and comparison prompts are original; no coastal field observation, gauge measurement or navigation trial was performed.