Choosing between global stocks and the S&P 500
Here, a broad global stock fund means one targeting developed and emerging markets including the US, such as the universe covered by MSCI ACWI. An S&P 500 fund narrows that scope to large US companies. Start with that difference before comparing recent returns. If you own both, remember that the global fund already includes US stocks.
Today's step is to finish one sentence: “I want broad global stock exposure,” or “I want to put more weight on US large companies.” Neither sentence requires knowing which market will lead next.
Compare the investment universe first
The MSCI ACWI Index covers large and midsize companies across developed and emerging markets, including the United States. The S&P 500 focuses on US large companies. Neither index represents every publicly traded company in its named territory, and an index is not itself an investment product.
For US-listed product examples, consider the iShares MSCI ACWI ETF, ticker ACWI, and the iShares Core S&P 500 ETF, ticker IVV. Their issuer product pages and fund descriptions identified those respective investment objectives when checked on October 12, 2026. These examples illustrate how to read a fund's documents; they are not endorsements or a shortlist of the best products.
| Question | Broad global stock fund | S&P 500 fund |
|---|---|---|
| Which stock markets does it target? | Developed and emerging markets, including the US | US large companies |
| What geographic choice does it make? | Holds the benchmark's global mix | Focuses on US large-cap stocks |
| What needs watching? | Countries are not equally weighted; the US still matters | Non-US stock markets and US small caps are outside its broad target |
| What happens if you combine them? | More US large-cap emphasis than global alone | Some non-US exposure compared with S&P 500 alone |
This is a comparison of coverage, not a ranking of returns or safety. Real funds can use different implementation methods. Their holdings need not form perfectly nested sets.
Decide which choice you want to make yourself
A global approach lets you own the benchmark's regional mix without having to select the next leading country. It still reflects the sizes and eligibility rules of the markets and companies it includes. “Global” does not mean equal amounts in each country, and it does not remove concentration in the largest holdings.
An S&P 500 approach makes a narrower choice: US large-cap stocks. That can be a deliberate preference, provided you understand the markets you leave out and can tolerate periods when they do better. “It did better recently” describes a period you have already lived through. By itself, it does not explain why the same choice will suit the years ahead.
Holding both can also be deliberate. You might want broad global exposure with additional emphasis on US large companies. But a 50/50 split between fund names is not a neutral 50/50 split between the US and the rest of the world.
A fictional allocation makes the overlap visible
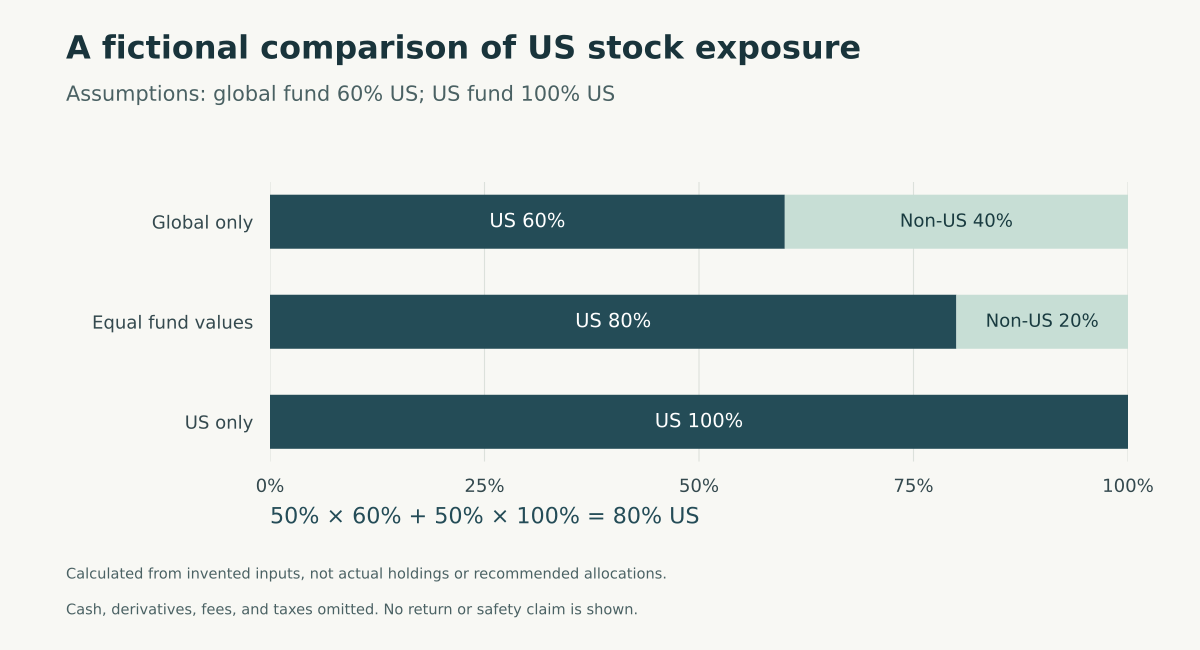
Assume a fictional global fund is 60% US stocks and 40% non-US stocks. Assume a fictional US fund is 100% US stocks. Ignore cash, derivatives, fees, and taxes. These are invented inputs, not current weights for ACWI, IVV, or any other named fund. They are not recommended allocations.
With $10,000 entirely in the fictional global fund, $6,000 represents US exposure and $4,000 non-US exposure. Now split that same $10,000 equally between the two fictional funds:
- The $5,000 global holding contributes $3,000 of US exposure and $2,000 of non-US exposure.
- The $5,000 US holding contributes another $5,000 of US exposure.
- Together, US exposure is $8,000 out of $10,000, or 80%.
The calculation is 50% × 60% + 50% × 100% = 80%. The remaining 20% represents non-US stocks.
Expand the diagram
Scroll within the diagram horizontally; arrow keys work when focused.
This weighted average answers one country-allocation question. It does not measure the percentage of identical securities, forecast volatility, or estimate how far the portfolio might fall. It also uses holding values at a particular moment. Equal monthly purchases would not keep two real fund balances equal as prices changed.
Check the holdings date and the denominator
For a real comparison, open both issuers' holdings reports and match their as-of dates. Check whether the percentages refer to net assets, equity holdings, or another denominator. Read how cash, derivatives, and country classifications are treated before calculating a combined weight. Do not turn unlike numbers into an apparently precise answer.
If the reports share holdings, compare the amount invested in those companies as well as their names. Also compare sectors at the same level of detail. A country total can conceal a larger position in particular companies or industries.
A company's country classification is not a map of its sales. MSCI's country-classification methodology and the S&P US index methodology set rules for identifying a company's market. Selling products abroad does not make ownership of a US company equivalent to owning companies classified in non-US stock markets.
Read the product documents alongside the benchmark
The ACWI summary prospectus retrieved for this article is dated November 28, 2025. The IVV summary prospectus is dated July 31, 2026. A prospectus date is not a holdings date.
The issuer-hosted full ACWI prospectus PDF includes a February 13, 2026 supplement. The full IVV prospectus PDF is dated July 31, 2026. The issuer’s regulatory-document list also links each fund’s Statement of Additional Information, or SAI. The ACWI SAI and IVV SAI include a September 11, 2026 supplement on intermediary payments. That update does not change the geographic investment objectives discussed here. The point is to read the dated base document together with its applicable supplements, rather than judging the whole package from the summary’s cover date.
For an ETF purchase, read the expense ratio and trading information as well as the portfolio. The bid-ask spread and a market price above or below net asset value are separate from the fund's annual expense ratio. The SEC's ETF investor bulletin explains those distinctions. This article makes no current cost ranking.
Compare returns only on matching terms
If a performance chart is part of your decision, check five things:
- The same start and end dates, rather than different funds' “since inception” periods
- The same currency, such as US dollars for both series
- Total returns with distributions reinvested, rather than one price-only series
- Consistent treatment of fund expenses and dividend withholding taxes
- A clear distinction between index returns, fund NAV returns, and ETF market-price returns
This article does not present a historical performance chart because a verified pair of comparable time series has not been prepared. The allocation chart is an original fictional illustration. It cannot tell you which fund performed better or which will do better next.
Write down the reason you could keep
Both choices remain stock investments. Geographic diversification can broaden what you own, but it cannot guarantee protection from a broad stock-market decline. The separate question of how much belongs in stocks, bonds, and accessible cash depends on your goals, time horizon, and capacity for loss. The SEC's asset-allocation guide explains that wider decision.
Your final sentence might be: “I want broad global stock exposure and accept that individual countries will do better at times.” Or: “I want to emphasize US large companies and accept that other markets may outperform them.” If you choose both, describe why you want more US large-cap exposure than the global fund alone provides.
Starting from S&P 500 alone, a global fund adds non-US exposure alongside overlapping US holdings. Starting from global alone, an S&P 500 fund increases US large-cap emphasis. Knowing your starting point makes the choice easier to explain, even when future returns remain unknown.
Sources checked October 12, 2026. The named issuer pages and issuer-listed summaries, full prospectuses and SAIs were checked for the product facts discussed here, including the supplements described above. No current combined holdings percentage, fee ranking or future performance claim is made. Consult the issuer’s current documents before a product decision.
This article provides general financial education and information, not individualized investment advice or a recommendation to buy, sell, or adopt a particular allocation. Investing involves risk, including loss of principal; stock prices and currency movements can cause losses. Diversification does not guarantee a profit or prevent loss. Past performance and fictional examples do not guarantee future results. Review current official documents and your own circumstances, seek qualified professional advice when appropriate, and remember that you are responsible for your final investment decisions.