Two funds track the same index. Is lower cost all that matters?
A lower cost is a useful advantage, but first make sure the funds give you the same exposure. Then separate the published fee, the costs of using the product, and its record of following the benchmark. One percentage cannot answer all three questions. You can make a better comparison without predicting which fund will perform best.
Put matching facts side by side
In this made-up example, Fund A advertises an annual expense ratio and Fund B displays a cost figure from its last shareholder report. Both aim to follow the same index. It is tempting to circle the smaller number and stop.
First ask what each number includes and which period it describes. A current stated rate and an expense measure covering an earlier reporting period are not automatically comparable. A temporary fee waiver can also change the figure presented. Find the terms and any expiration date before treating a reduced rate as permanent.
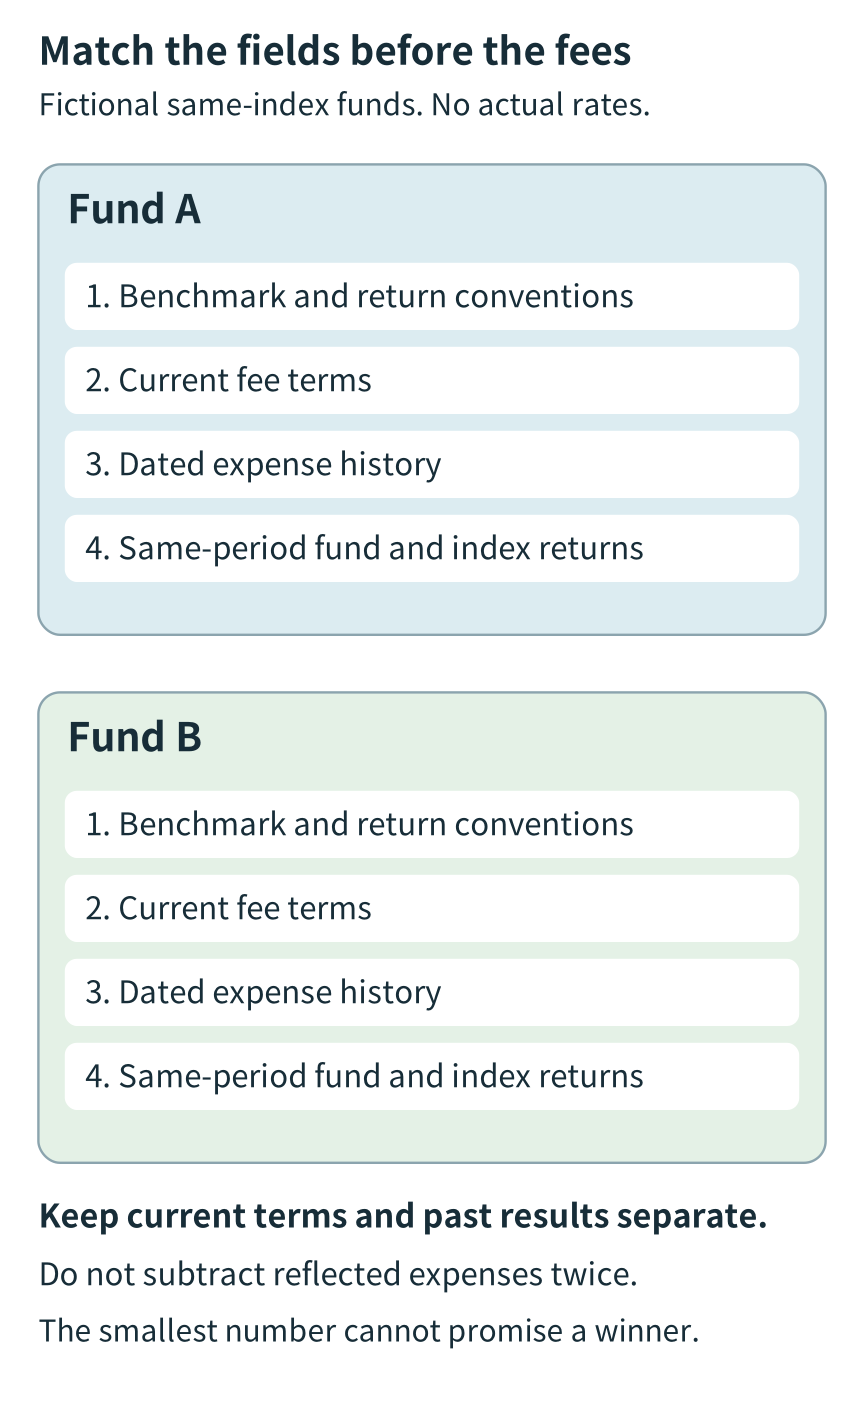
The exercise is to build matching columns, not to invent a winner. For each candidate, record the exact benchmark, current fee terms, dated expense information and comparable performance period. Leave a missing field blank until you can verify it.
Check the full benchmark name
“US stocks” or “global stocks” is a category, not a complete specification. Read the index name, the market coverage, the return currency and the treatment of dividends. Check whether a currency hedge changes the exposure. If these differ, a return gap can reflect different investments or calculation rules rather than better execution.
A price-only index and a total-return measure that includes dividends answer different questions. Gross and net dividend conventions can also differ, as described in the MSCI calculation methodology. Avoid mixing those figures when checking tracking. The fund’s own stated benchmark and its performance footnotes are the starting point, rather than whichever chart is easiest to find.
For a dated document-reading example, the iShares Core S&P 500 ETF summary prospectus dated July 31, 2026 identifies its investment objective, fee table and risks. It is included to show where to look, not to endorse IVV, quote a current fee or compare it with a global-stock fund. The issuer’s regulatory-document list links the full prospectus and SAI as well. A summary is a starting point, and later supplements must be read with the document they amend.
The expense ratio has boundaries
The SEC’s 2025 fees and expenses bulletin explains the prospectus categories. Total annual fund operating expenses, commonly called the expense ratio, cover ongoing fund expenses. They do not necessarily capture everything you pay directly or indirectly.
For example, brokerage charges can sit outside the table, and the portfolio itself can incur transaction costs when buying or selling securities. The July 2026 IVV prospectus distinguishes portfolio transaction costs from its annual operating-expense table. Read the exclusions instead of assuming that “total” means the entire cost of investing through your account.
Operating expenses reduce fund assets and returns. They need not appear as a separate cash debit on your brokerage statement. When examining a reported fund return already net of operating expenses, subtracting the expense ratio again would count that cost twice. Checking the published rate and checking the resulting performance are complementary tasks.
Expand the diagram
Scroll within the diagram horizontally; arrow keys work when focused.
Figure: Four matching fields for a comparison. Blank fields mean more information is needed.
Separate a return gap from tracking error
For a chosen period, subtract the benchmark’s return from the fund’s return. That signed gap is commonly called tracking difference. Here the convention is fund minus benchmark; check the sign convention used by any source you read.
Tracking error asks a different question: how variable are the fund’s periodic return differences from the benchmark? It describes variation across repeated observations rather than one cumulative gap. A single one-year subtraction is not that statistic. The issuer’s explanation of tracking measures distinguishes these concepts. Only the terminology is used here, not the page’s UK tax or product guidance.
Before comparing reported tracking-error figures, check the observation frequency, date range and annualization convention. A small tracking error does not, by itself, establish the smallest cumulative return shortfall. You do not need to calculate a new statistic to begin; understanding the provider’s definition is more useful than attaching a familiar name to the wrong number.
A gap is not a receipt for hidden fees
The SEC’s index-fund overview identifies fees, trading costs and sampling as reasons performance may differ. Other implementation details can matter too. Treating the whole return gap as a pure expense measure would hide those distinctions.
Use the same start and end dates, currency and dividend-reinvestment assumptions. For an ETF, distinguish NAV total return from market-price return. Your own result also depends on the price and time at which you trade. A published tracking record is evidence about a past period, not a promise about the next one.
The product still has to work in your account
An ETF can have a low expense ratio while its trading conditions add costs. Check the bid-ask spread, any broker commission, and premiums or discounts to NAV. A spread is the difference between quoted buying and selling prices; a premium or discount compares the market price with NAV. They are not interchangeable figures. The SEC’s ETF bulletin explains these trading considerations.
Also check how distributions are handled and whether the account supports the purchases you intend to make. A cash distribution alone is not a complete measure of return. Tax treatment can depend on the account and your circumstances; an expense-ratio comparison cannot determine your after-tax result. No particular tax treatment or account choice is assumed here.
Write down one candidate’s exact benchmark and the period attached to its expense information. Do the same for the next candidate. If those match, you are ready to compare costs and tracking more meaningfully. Lower cost matters; it does not guarantee future leadership.
Sources checked October 12, 2026. The IVV reading example uses the July 31, 2026 summary and full prospectus and the issuer-linked SAI, including its September 11, 2026 supplement on intermediary payments. The supplement does not change the fee-category distinction explained here. No current rate, fee ranking or account eligibility is asserted. Recheck current prospectuses, supplements and account terms before acting.
This article provides general financial education and information, not individualized investment advice or a recommendation to buy, sell, or adopt a particular allocation. Investing involves risk, including loss of principal; stock prices and currency movements can cause losses. Diversification does not guarantee a profit or prevent loss. Past performance and fictional examples do not guarantee future results. Review current official documents and your own circumstances, seek qualified professional advice when appropriate, and remember that you are responsible for your final investment decisions.