Saving or investing $300 a month: what the growth numbers actually mean
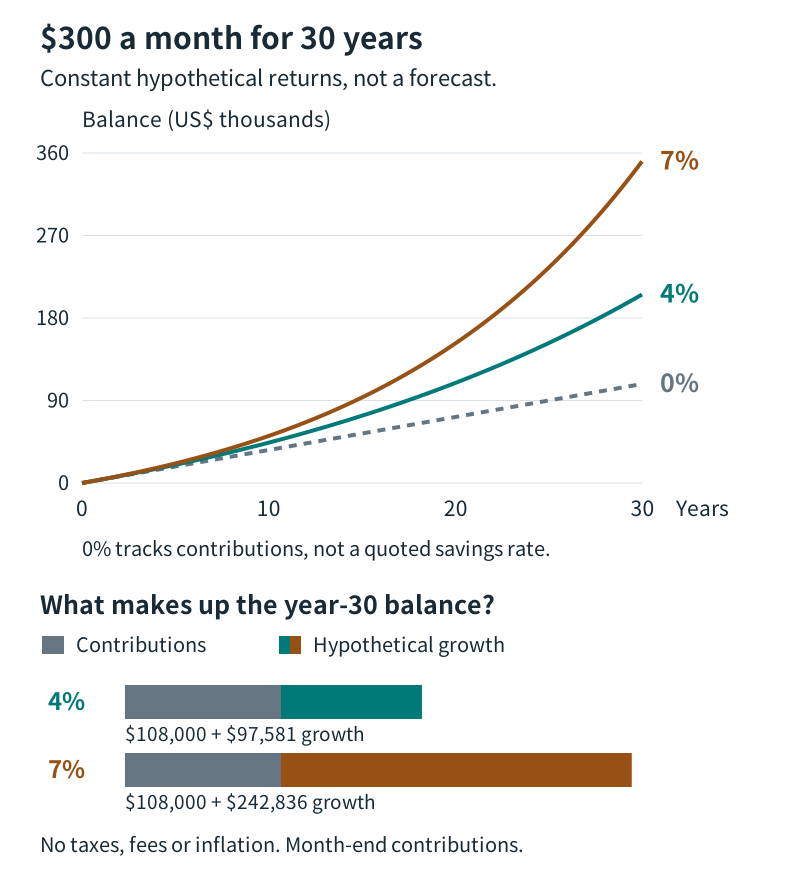
Put aside $300 a month for 30 years and your contributions total $108,000. At a hypothetical steady 4% annual return, the balance would reach about $205,600. At 7%, it would reach about $350,800. Those larger numbers explain why long-term investing attracts attention. They don't tell you which return you'll receive or whether stocks are suitable for money you need soon.
A useful comparison separates three things: the terms of a savings product, a mathematical scenario, and an investment's historical record.
Start with the savings account you can actually use
“Cash earns nothing” is a poor starting assumption. The FDIC's September 2026 national rates, published through the Federal Reserve's FRED database, were 0.37% for savings and 1.73% for a 12-month CD. These are deposit-weighted national averages, not the best available offers or a quote for your account. Both series were updated September 21.
Individual offers can differ substantially. Ally's savings page listed 3.10% APY, dated October 8, 2026, across its balance tiers, with no minimum opening deposit or monthly maintenance fee. Its rate is variable. This is a dated example, not a recommendation or a promise that the rate will persist.
APY includes compounding over a year. A CD can fix a rate for its stated term, but renewing it later doesn't lock in the same rate. Check the maturity date, renewal rules and early-withdrawal penalty. For example, Ally's High Yield CD terms impose a 60-day interest penalty for terms from three through 24 months, prohibit partial withdrawals, and don't permit additional deposits before maturity. A monthly contribution plan therefore isn't the same thing as buying one CD.
Separate your contributions from investment growth
For a clean illustration, start at zero, contribute $300 at each month-end, and leave all returns invested. Contributions stay flat. The 0% column tracks the money you put in; it doesn't mean savings accounts pay no interest.
| Time | Contributions / 0% | Hypothetical 4% | Hypothetical 7% |
|---|---|---|---|
| 10 years | $36,000 | $44,009 | $51,316 |
| 20 years | $72,000 | $109,153 | $152,261 |
| 30 years | $108,000 | $205,581 | $350,836 |
These are effective annual rates, converted to equivalent monthly rates using (1 + annual rate)^(1/12) − 1. Simply dividing the annual rate by 12 gives slightly different results. The illustration excludes taxes, fees and inflation and assumes no interruptions or losses. Figures are rounded to the nearest dollar.
Expand the diagram
Scroll within the diagram horizontally; arrow keys work when focused.
Figure: Original calculations. Constant hypothetical returns; no taxes, fees or inflation. The 0% line is the contribution baseline.
At 30 years, the growth above contributions is about $97,600 in the 4% case and $242,800 in the 7% case. Under the 7% assumption, the first decade adds about $15,300 of growth; the final decade adds about $162,600, excluding that decade's $36,000 of new contributions. Returns build on a much larger balance, including earlier returns.
The acceleration depends on the positive-return assumption. A real stock portfolio can fall even while you keep contributing. Use several scenarios to understand how a plan changes, rather than treating the largest result as money already available to spend.
A larger balance can still buy less
The balance on your statement is a nominal dollar amount. Its purchasing power depends on prices. Suppose inflation is a steady 2% and an untouched $10,000 earns nothing. After 20 years, it would buy about what $6,730 buys today. The 2% rate is an illustration, not a current inflation reading or forecast.
If your return after taxes and fees were 4% while inflation were 2%, the real return would be approximately 1.96%: 1.04 divided by 1.02, minus one. That after-tax example uses different assumptions from the before-tax table. We haven't assigned a universal US tax rate; account type and individual circumstances matter.
Inflation risk doesn't eliminate the value of accessible cash. Emergency expenses and near-term bills still need funding. FDIC protection covers eligible deposits up to $250,000 per depositor, per insured bank, per ownership category. It doesn't insure purchasing power or cover stock and mutual-fund losses.
Historical stock returns come with losing years
A broadly diversified stock fund spreads ownership across many companies. It can earn returns through price changes and dividends, but diversification doesn't prevent a market-wide loss. The SEC's asset-allocation guide makes both time horizon and the ability to bear losses part of choosing an investment mix.
Consider one historical reference, separate from our scenarios. The MSCI World factsheet dated September 30, 2026 reports a 9.02% annualized return since December 31, 1987. It also records a 17.73% loss in calendar 2022. These are US-dollar gross index returns with dividends reinvested, before fund expenses and investor taxes. MSCI World covers developed-market stocks; it isn't an all-country index or an investable account.
“Annualized” converts the whole period's growth into a compound yearly rate. It doesn't describe each individual year. If $100 rises 20% and then falls 20%, it finishes at $96, even though the two returns average zero arithmetically. With recurring contributions, the timing of deposits and the sequence of market returns also affect the result.
Neither the historical figure nor a 30-year horizon makes 4% or 7% a safe minimum. The smooth curves above deliberately omit the uncomfortable part of actual investing: not knowing the next return.
Check one real number before changing anything
Find your account's APY and withdrawal terms. Then separate the money needed for emergencies and near-term spending from money whose value can fluctuate. The companion article, “Why invest if you already save? Start with when you need the money”, explores that time-horizon decision.
For longer-term money, compare a fund's risks and costs with several contribution-and-return scenarios. A gap in the plan may call for different contributions, timing or goals. It doesn't automatically call for taking more risk.
Sources checked October 12, 2026. Product rates and terms can change; verify the provider's current disclosures before applying.
This article is for informational purposes. Investing involves the risk of losing principal. Past performance and hypothetical projections do not guarantee future results. You are responsible for your final investment decisions.