How much should you save each month for retirement? Compare your age and starting balance
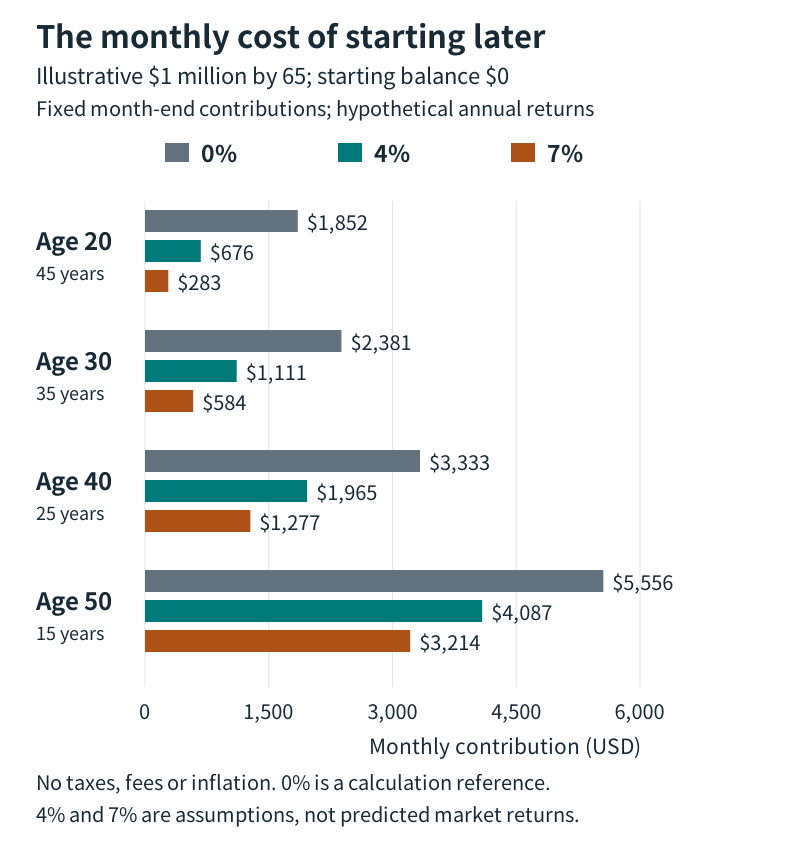
To reach an illustrative $1 million by age 65, someone starting from zero at 20 would need about $676 a month at a constant hypothetical 4% annual return. Starting at 50 raises that figure to about $4,087. Time and money already saved change the monthly amount substantially. Neither $1 million nor a 4% return is a recommendation for everyone.
A useful retirement calculation works backward from a goal. It also makes clear whether that goal is a future account balance or an amount of purchasing power in today's dollars. Here, we compare starting at exactly 20, 30, 40 and 50, with three different balances already set aside. Someone starting at 28 has a different time horizon from the age-20 example.
Choose a target you can explain
The $1 million target is a round number chosen to show the calculation. It isn't an estimate of what every US household needs, a guarantee of lifetime income, or an amount converted from another country's retirement benchmark.
Your spending, housing, health costs, Social Security, pensions, other income and retirement date shape the amount your savings must support. Start with the expenses you expect savings to cover after accounting for other income. The Social Security Administration's planning guidance treats stopping work and claiming benefits as separate decisions, influenced by individual circumstances.
Age 65 is simply this article's target date. Under current Social Security rules, full retirement age is 67 for people born in 1960 or later. Reaching this example's savings target at 65 does not mean receiving an unreduced Social Security retirement benefit then.
The amounts below are account balances before any taxes due on withdrawals. A dollar in a pre-tax account and a dollar available to spend are not necessarily equivalent. This model does not turn a target balance into a retirement income plan.
See what changes when you start later
The comparison uses the same assumptions throughout:
- The initial target is a fixed, future nominal balance of $1 million at 65
- The starting balance is invested immediately and left invested for the full period
- Equal contributions arrive at each month-end, without interruptions or withdrawals
- The hypothetical effective annual return is 4% or 7%, converted to an equivalent constant monthly rate, with returns reinvested
- Taxes, fees and, initially, inflation are excluded
Count money actually reserved for this goal. Emergency savings and money needed for near-term bills should not also be counted as fully invested retirement assets. Home equity that you do not plan to release is not an available starting investment balance.
Expand the diagram
Scroll within the diagram horizontally; arrow keys work when focused.
Figure: Original calculations, rounded to the nearest dollar. The 0% series is a no-growth reference, not a quoted savings-account rate. Neither 4% nor 7% is guaranteed.
Even with no growth, spreading the goal over 45 years rather than 15 lowers the monthly amount from about $5,556 to $1,852. A longer runway means more contribution dates. With positive returns, earlier deposits also have more time to grow. Actual investment returns can be negative, so the larger benefit shown by the investment scenarios remains conditional.
Add what you already have
These tables show the additional monthly contribution, after investing the starting balance separately. Figures are rounded to the nearest dollar, not rounded up into exact instructions for funding an account.
A $0 entry means the starting assets alone reach the target if that particular return assumption holds. It does not mean you can safely stop saving or that the money is guaranteed.
Assuming a constant 4% annual return
| Starting age | Years to 65 | Starting with $0 | Starting with $100,000 | Starting with $250,000 |
|---|---|---|---|---|
| 20 | 45 | $676 | $281 | $0 |
| 30 | 35 | $1,111 | $673 | $15 |
| 40 | 25 | $1,965 | $1,441 | $655 |
| 50 | 15 | $4,087 | $3,351 | $2,247 |
Assuming a constant 7% annual return
| Starting age | Years to 65 | Starting with $0 | Starting with $100,000 | Starting with $250,000 |
|---|---|---|---|---|
| 20 | 45 | $283 | $0 | $0 |
| 30 | 35 | $584 | $0 | $0 |
| 40 | 25 | $1,277 | $584 | $0 |
| 50 | 15 | $3,214 | $2,328 | $997 |
Both tables exclude taxes, fees and inflation. A 7% scenario is not a safe minimum return. Every $0 cell assumes the starting assets remain invested and grow as specified; none reports a probability of success.
Consider the age-30 example with $250,000 already invested. At a constant 4% over 35 years, that balance grows to about $986,522, leaving a small gap that requires roughly $15 a month in this model. At age 50, the same starting balance has only 15 years to grow, and the monthly requirement is about $2,247. The model grows the existing balance for the entire period; it doesn't simply subtract today's savings from the target and ignore their subsequent returns.
The monthly figure represents total new money entering the modeled retirement portfolio. It is not a legal contribution allowance for one IRA or workplace plan. If you include an employer contribution, count it once, check the plan's conditions and vesting rules, and distinguish it from what must come out of your own paycheck. The companion article, “Should your next retirement dollar go into a 401(k) or an IRA?”, covers the separate account-choice question. Account limits and tax benefits do not change this calculation into guaranteed growth.
Decide whether $1 million means today's buying power
A fixed $1 million decades from now may buy much less than $1 million today. Inflation changes purchasing power. The Federal Reserve's explanation of inflation describes the general rise in prices over time; your own mix of expenses may change differently.
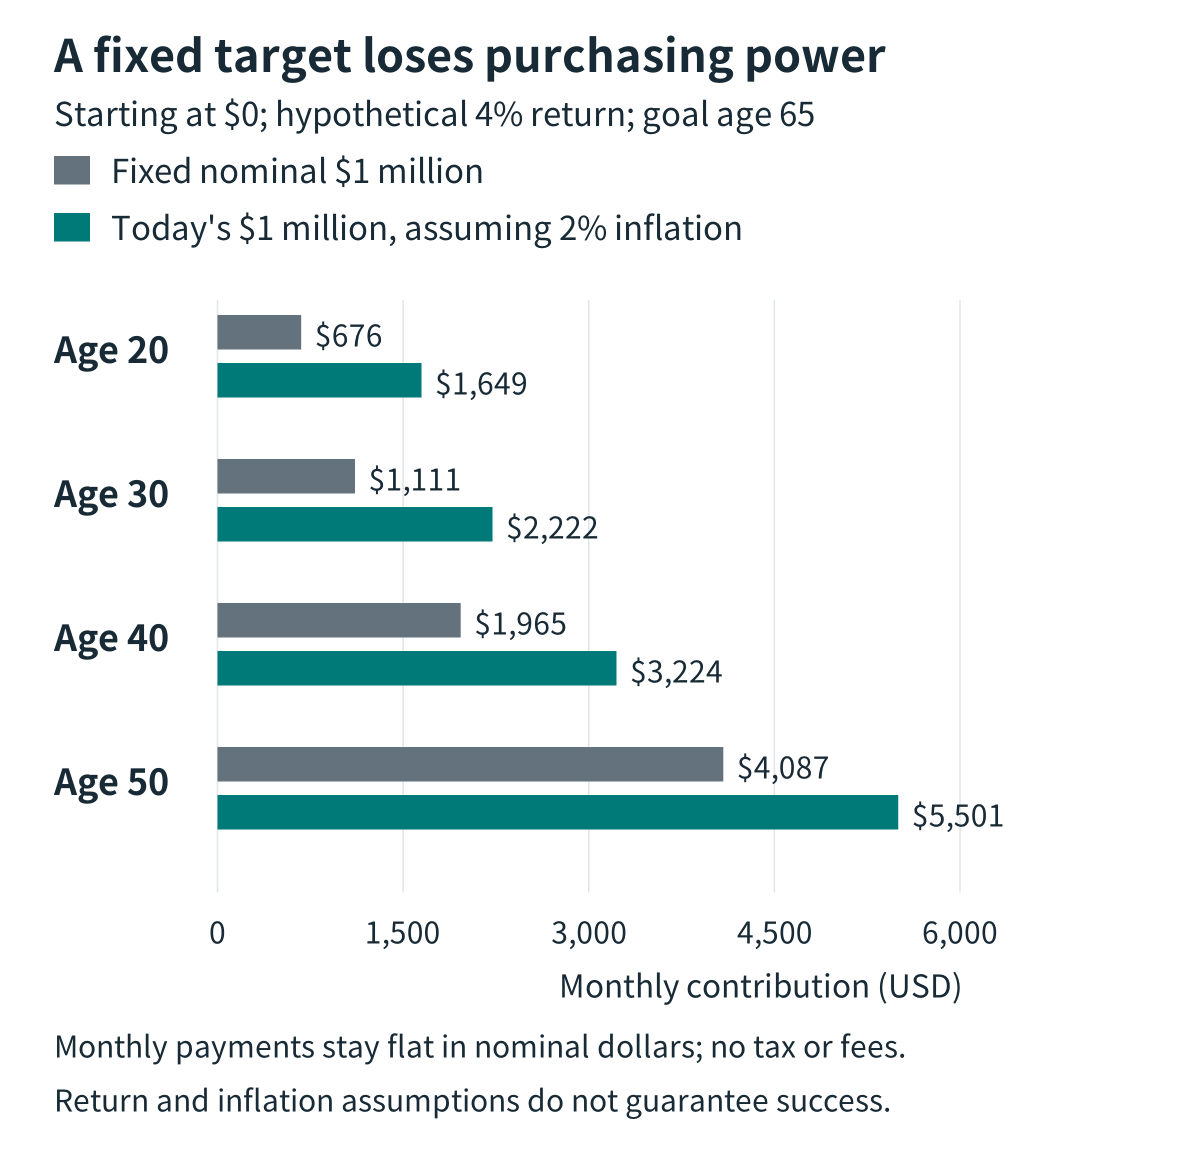
Suppose prices rise by a constant 2% a year. This is an illustrative assumption, not a forecast. To match today's $1 million of purchasing power, a 20-year-old's target at 65 becomes about $2.44 million.
| Starting age | Future target matching today's $1 million | Monthly amount from $0 at 4% |
|---|---|---|
| 20 | $2,437,854 | $1,649 |
| 30 | $1,999,890 | $2,222 |
| 40 | $1,640,606 | $3,224 |
| 50 | $1,345,868 | $5,501 |
These figures assume 2% annual inflation and a separate 4% nominal annual investment return. Contributions stay flat in nominal dollars; this is not a plan that increases contributions with inflation each year. Amounts are rounded to the nearest dollar, and taxes and fees remain excluded.
Expand the diagram
Scroll within the diagram horizontally; arrow keys work when focused.
Figure: Original calculations. A longer horizon gives investments more time, but also gives rising prices more time to change the dollar amount needed. Neither assumption guarantees the outcome.
Use the result to adjust a plan
Before choosing an assumed return, write down three inputs: a goal age, a target with a clear dollar basis, and the amount already reserved for retirement. Check your personalized benefit estimate through Social Security's calculator hub, rather than substituting someone else's benefit amount.
Then compare the monthly result with what your budget can sustain. If the gap is too large, examine contributions, timing and intended spending. Raising the assumed return makes the displayed payment smaller, but does nothing by itself to improve what your investments will earn.
The smooth-rate calculation leaves out losses, changes in asset allocation, contribution interruptions and market declines near retirement. An average return alone cannot describe the path your money takes while new deposits arrive. Investment fees also reduce what remains invested. Review the plan as circumstances change instead of treating one spreadsheet result as a commitment from the market.
The 4% used here is an assumed accumulation return. It is not a withdrawal-rate rule and does not say how long the balance will last in retirement. That requires a separate analysis of spending, income, longevity, taxes and risk.
You can use the companion article, “Saving or investing $300 a month: what the growth numbers actually mean”, to understand how a fixed contribution builds a balance. This article works in the other direction: choose a goal you can justify, then examine the monthly amount it implies under several assumptions.
How the calculation works
The equivalent monthly rate is (1 + effective annual return) raised to the power of 1/12, minus 1. The model first calculates how much the initial balance would become, then solves for the equal month-end contributions needed to fill any remaining gap. Dividing the annual rate by 12 produces slightly different results. The accompanying calculation material records the full formula and unrounded scenarios.
Sources checked October 12, 2026 UTC. Rules and personal circumstances can change.
This article provides general financial education, not individualized investment or tax advice. Investing involves the risk of losing principal. Past performance, hypothetical returns and projections do not guarantee future results or achievement of a savings target. You are responsible for your final investment decisions.